HUBLE METHODS
Ex vivo micro-computed tomography analysis of mouse trabecular bone
Full Text
PDF
Full Text
Introduction
This HubLE Method describes the protocol for quantitative ex vivo trabecular bone analysis of mouse long bones using micro-computed tomography.
Materials
μCT scanner
Powerful computing equipment
Sample holders
X-ray transparent film, e.g. Parafilm®
Methods [Update]
- Isolate long bones from mice, remove the soft tissue and wrap them in Parafilm® before placing them in a sample holder [Tip No.1].
- Set the X-ray source at a voltage of 50-70kV, with a current of 115-150μA. Also, insert a 0.5mm aluminium filter to reduce beam hardening artefacts [Tip No.2].
- For mouse bones set the voxel size at 4-5μm [Tip No.3] and the rotation step at 0.4–0.6° [Tip No.4].
- Chose the optimal integration or exposure time as per manufacturer’s instructions.
- Select the region you would like to scan and start scanning [Tip No.5].
- Once the scan has finished load the projection images into a reconstruction software [Tip No.6].
- If you are using Bruker’s NRecon reconstruction software, adjust the parameters ‘beam-hardening factor correction’ to 10-40% and ‘ring artefact reduction’ to 4-10 as needed.
- After reconstruction, images can be analysed using an analysis software [Tip No.7].
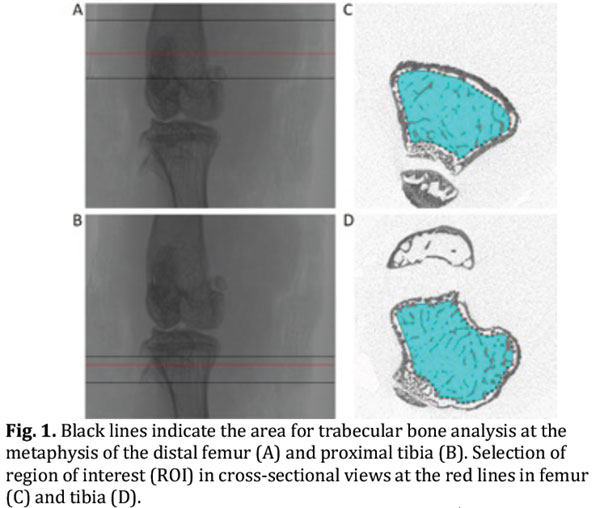
- For trabecular bone analysis select a region of interest (ROI) distal to (tibia) or proximal to (femur) the growth plate (Fig. 1, panel A and B) [Tip No.8].
- Specify the ROI using a manual or semi-automatic drawing tool at different levels (Fig. 1, panel C and D) [Tip No.9].
- Apply noise reduction filter (e.g. Gaussian), perform global threshold and use a despeckling operator to remove unconnected speckles [Tip No.10].
- Trabecular output parameters are calculated using a 3D-analysis software [Tip No.11].
- 3D-models of trabecular bone can be visualised using a 3D visualization software [Tip No.12].
Tips [Update]
- Alternatively, the sample can be wrapped in wet paper tissue and then placed in a sample holder.
- Aluminium filter can be 0.25mm, if the sample holder is small.
- Voxel size of 4-5m is ideal to measure mouse trabecular structures. This could be increased to 10m for in vivo applications but anything larger would result in poor resolution and insufficient microarchitectural detail.
- Averaging of several images at each rotation step can further improve the quality of the images. However, this comes at the expense of increasing scan time.
- When selecting the region to scan remember to include the growth plate. This is because the growth plate is a useful anatomical landmark for the standardization of the analysed metaphyseal range.
- Use for example NRecon software or IPL software for reconstructions.
- Use for example CTAn software or IPL software for analyses.
- Once you identify the fine textured primary spongiosa just downstream of the growth plate, notice where the bridge formed across the bone breaks. Set this as your reference point and move down 100m distally in the tibia or move up 100m proximally in the femur. These will be your starting points. A typical region that is analysed in the tibia is 1mm of the proximal tibia from the reference level, or 2.25mm of the distal femur from the reference level.
- The total volume of interest for all frames selected will be produced by auto-interpolation between the different ROI levels.
- Please apply visually selected global threshold for bone and perform despeckle for speckles <150 voxels.
- Typical trabecular output parameters are trabecular bone volume fraction, trabecular thickness, trabecular separation, trabecular number, structure model index and trabecular pattern factor or connectivity density.
- Use for example CTvol software or mCT Ray software for 3D images.
References [Update]
- Campbell GM, & Sophocleous A. Quantitative analysis of bone and soft tissue by micro-computed tomography: applications to ex vivo and in vivo studies. BoneKEy Reports, vol. 3, 2014.
- van ‘t Hof RJ, Dall’Ara E. Analysis of Bone Architecture in Rodents Using Micro-Computed Tomography. Methods Mol Biol. 2019;1914:507-531.
- Bouxsein ML, Boyd SK, Christiansen BA, Guldberg RE, Jepsen KJ, & Muller R. Guidelines for assessment of bone microstructure in rodents using micro-computed tomography. J Bone and Miner Res, 2010;25:1468–1486
PDF

Antonia Sophocleous PhD
Department of Life Sciences, School of Sciences, European University Cyprus, 1516, Nicosia, Cyprus.
Email: a.sophocleous@euc.ac.cyk

Enrico Dall’Ara PhD
Department of Oncology and Metabolism and Insigneo Institute, University of Sheffield, Sheffield, S10
2RX, UK.
Email: e.dallara@sheffield.ac.uk


